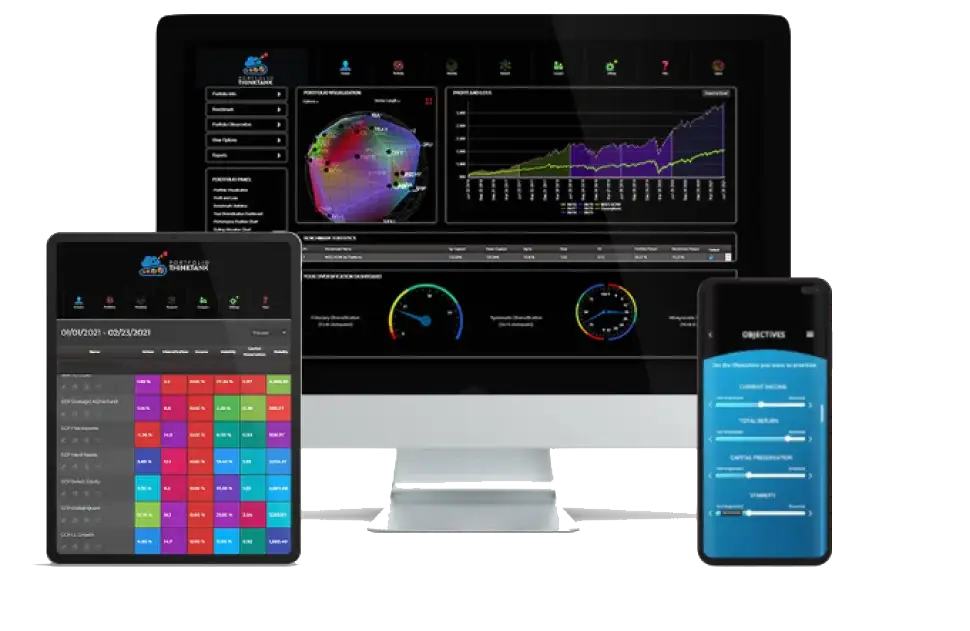
Your Ultimate Digital Advice Platform
Configurable White Label RoboAdvisor Implementations for Financial Brands and Influencers
The Most Configurable Hybrid Digital Advice Platform Powered by Diversification Optimization and the Science of Diversification.
With over 23 years of experience, our platform is the most configurable and capable, built on our pioneering developments in driving the Science of Diversification

Who We Serve
Choose the Persona that describes you best and start
along the path of building your ultimate Investing machine.


Hedge Fund, Family Office or
Institutional Investor
This is the page for buy side investors who are focused on delivering the best portfolio strategies, portfolio optimization and investment performance to investors


State Registered
Advisor
Usually State registered investment advisors begin working with Gravity Investments using our SaaS Portfolio Construction tools

As Featured in


Portfolio (RE) Optimization
Modern a.I. Portfolio Construction Technology
Our Digital Advisory Solutions are powered by optimization and feature Gravity’s pioneering work in the science of diversification. Our Portfolio Re-Optimization Technology raises the standard of Asset Allocation by integrating evolution into every portfolio. Automating a portfolio without re-optimization is like a self driving car that can only turn left.

RoboAdvisor Features
Whether you want to implement your own digital advisors platform, provide
recommendations, get compliant on diversification and process documentation,
or just create better portfolios; we got you covered:
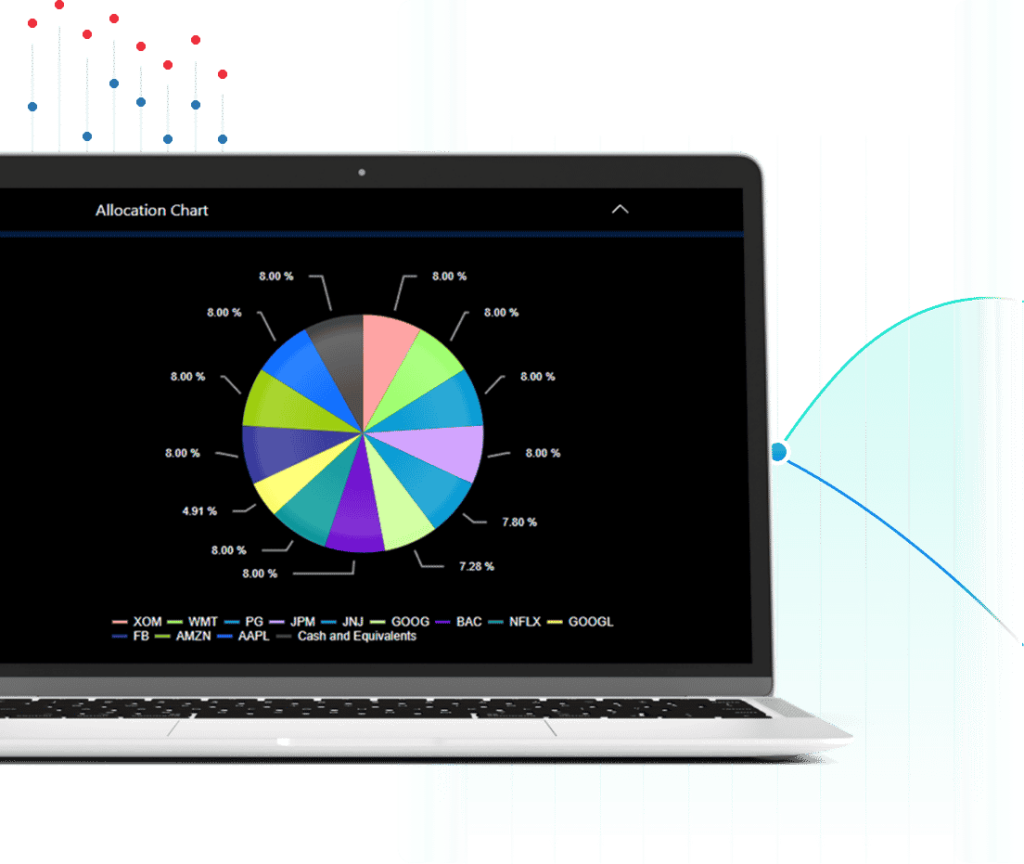

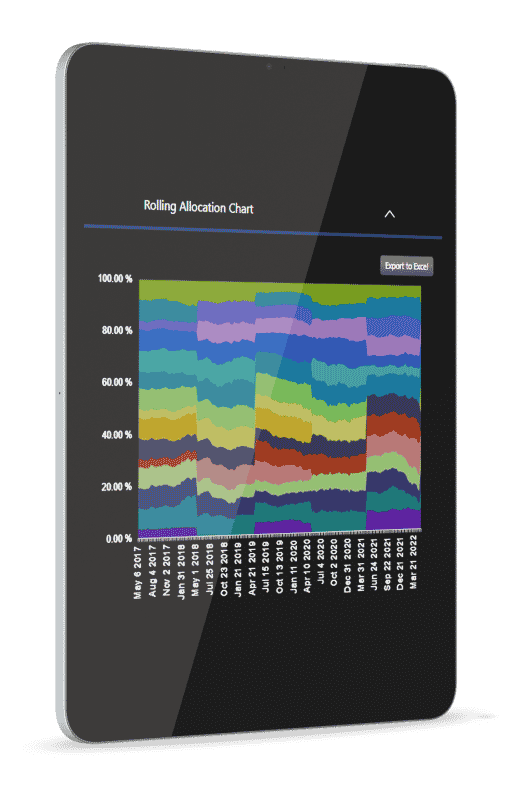
Asset Allocation
Gsphere is a powerful digital advice platform that features Gravity’s pioneering work in the science of diversification. Portfolio Re-Optimization Technology raises the standard of asset allocation with strong analytics, onboarding proposals, backtesting, and automation.

Optimization
A systematic process is good. Mean-variance optimization is better, but we built Diversification Optimization (DVO) to give investors the best chance for a more optimal portfolio, efficiently constructed for what is actually important to your investor.
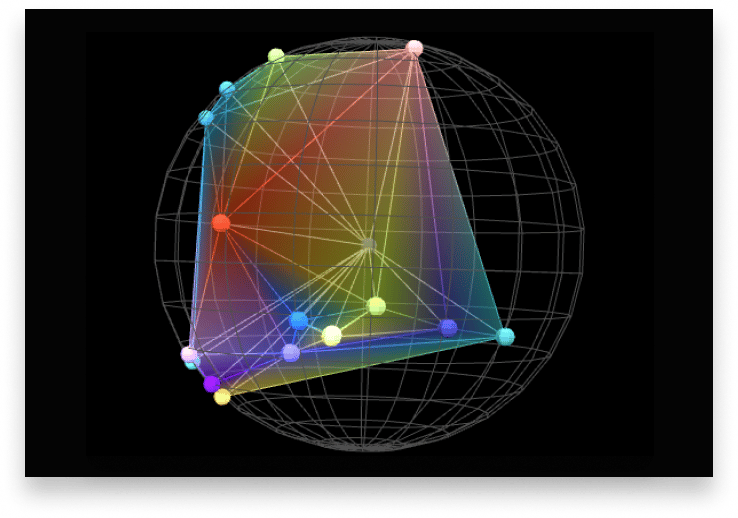

Portfolio Visualization
A picture is worth a thousand words. So tell a better story! Teach investors what they need to learn about diversification, be objective and earn their trust. By Using 3D balance (Symmetry) patently mapping to any portfolios exact measurable diversification, it could not be more intuitive. It’s like a 3D MRI for your investment account.

Re-Optimization
Asset allocation is when you designate a plan to follow. Portfolio optimization is when you perform asset allocation efficiently, given the investor’s objectives. Finally, portfolio Re-Optimization is when you optimize the portfolio regularly, knowing that the markets will constantly be changing and the best portfolios change with the times. Combining diversification and re-optimization with a hint of momentum, we think there is a sweet spot that won’t chase performance, stays in tune with the market, and serves to protect investor capital from unknown risks.
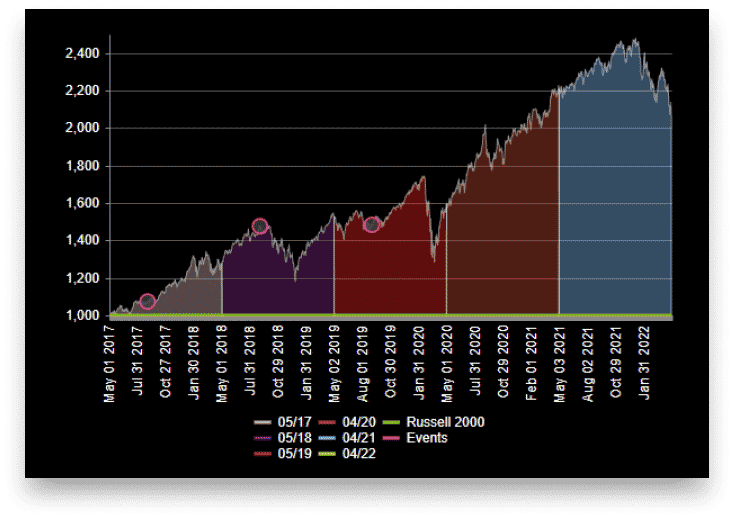

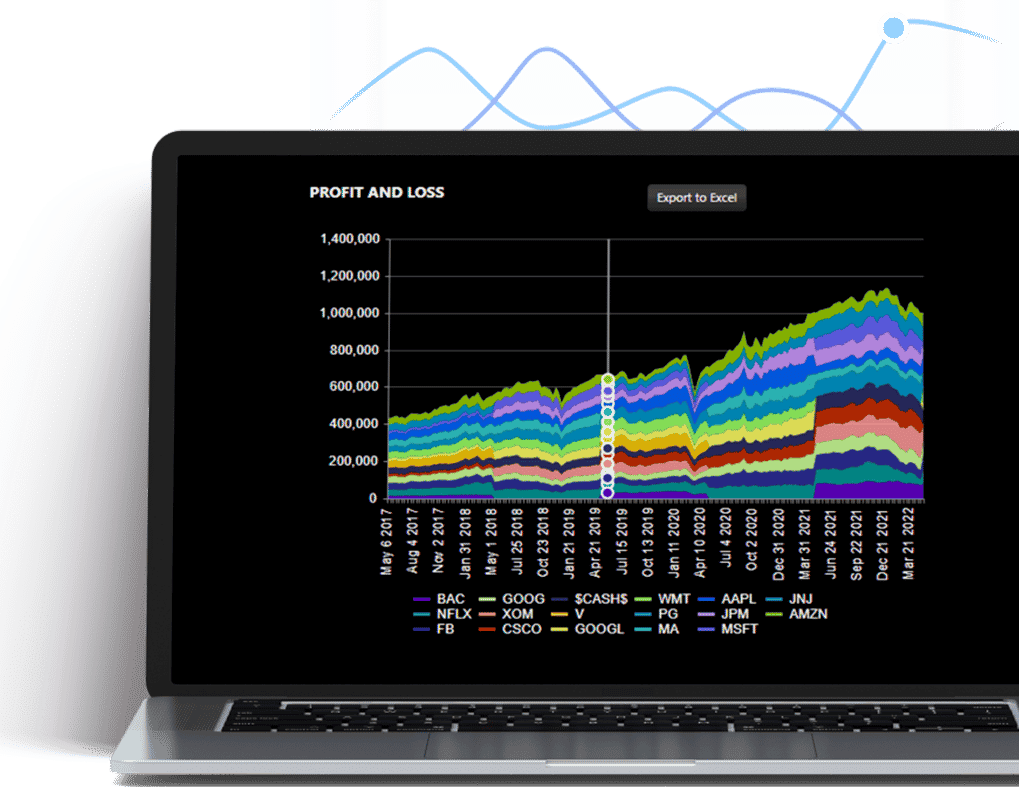
Backtesting
Portfolio Backtesting shows how the investment strategy performs over time. When creating custom portfolio strategies for investors, the backtest serves as a crucial proof statement.

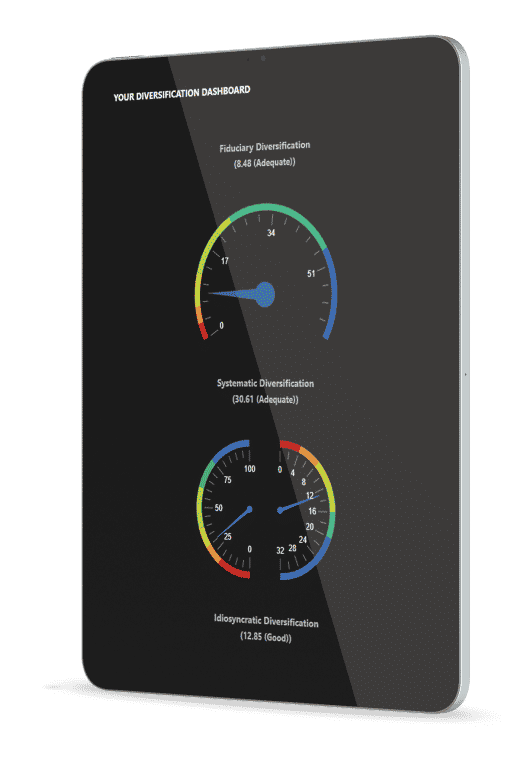
Diversification Analytics
We patented Diversification Optimization, Diversification Visualization, and Diversification Measurement. It’s time to bring diversification to the table for all of your investor conversations. Risk, return, and diversification. And since most investors have much worse diversification than they think, you can objectively illustrate how they are positioned and what they need to do to fix it.
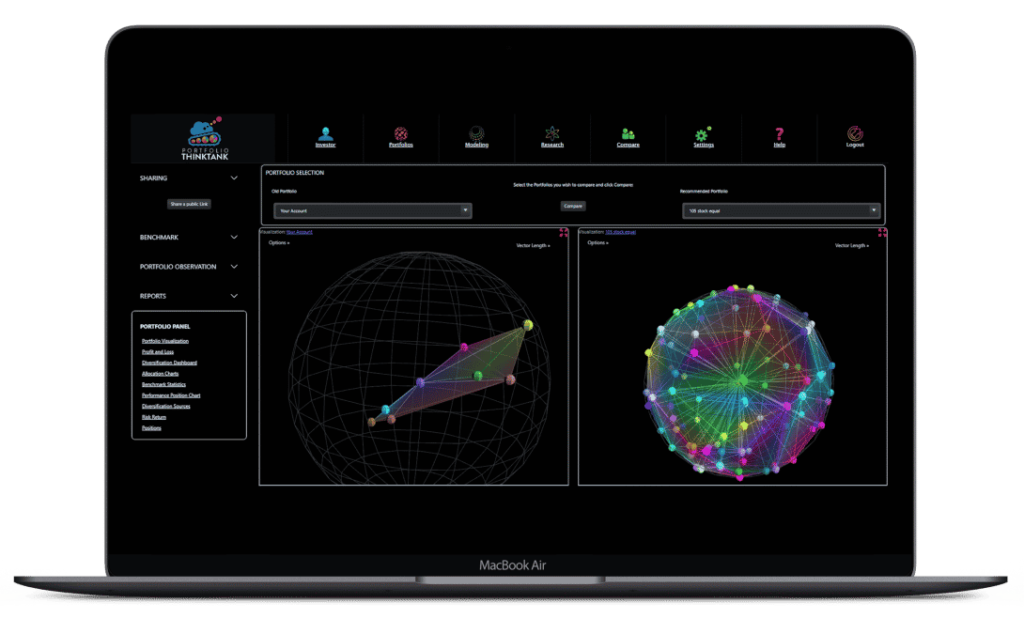

Portfolio Comparisons
Portfolio Comparisons is the ultimate before and after tool. Put it on the big screen and win more HNW business. Offer a free portfolio review. Teach, visualize and practice better diversification.
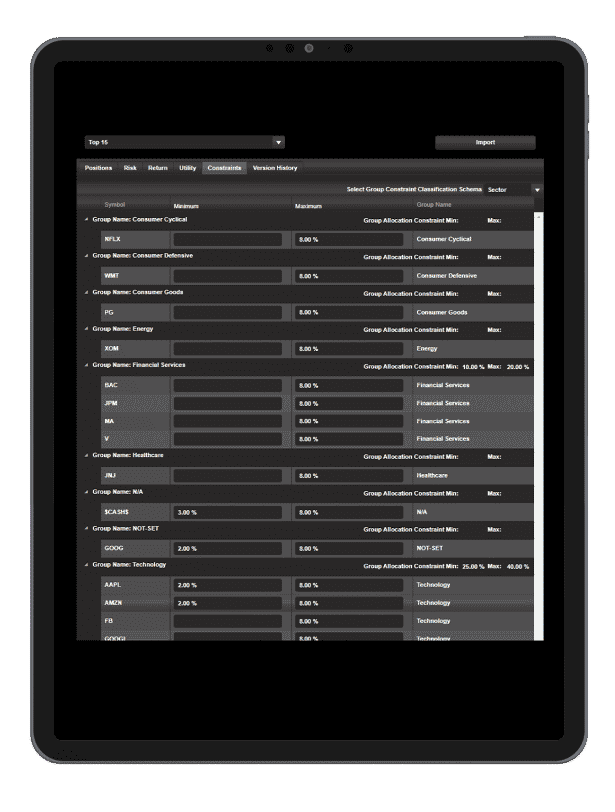

Constraints
An optimal portfolio is only optimal if it is implemented. Often, we need to specify the blueprints of the portfolio strategy to ensure we don’t take on additional risk by succumbing to various concentrations. We control these concentrations and risks to help ensure a pragmatic, implementable portfolio by providing constraints: This includes minimum & maximum position contractions, threshold constraints, and group constraints by various classifications such as sector, industry, asset class, and asset type.

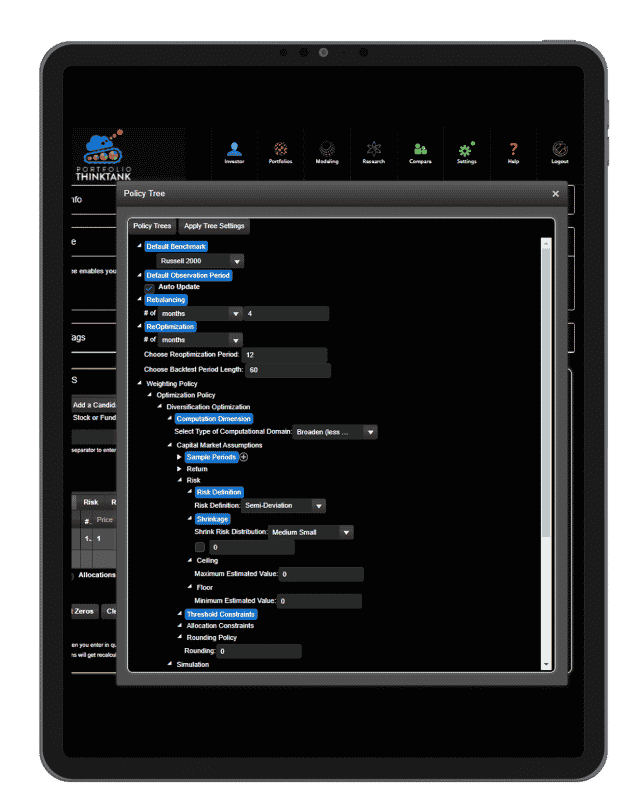
The Policy Tree
Our unique Policy Tree is unlike anything you’ve seen in the industry. It is a powerful rules engine that combines rules governing how a portfolio gets built, managed, and automated. It can create portfolios of almost any strategy and combines different investment sets and user preferences to create the perfect customized optimal portfolio for your investors.
Performance Analytics
Evaluate your performance and see results yourself
What are they saying?

Jeremy J. Black
Founder and inventor of RAMCAP, the "intelligent asset allocator" one of the first desktop investment diversification systems; Former Adjunct professor to the College for Financial Planning; Co-Creator of one of the first "Fund of Funds" hedge funds - twice named in the top 10 by the Wall Street Journal.